The control plane for
self-hosted MongoDB & Postgres
Monitoring, Studio, and query tuning as deep as a managed service — for the databases you run on Kubernetes, VMs, or bare metal. Free to connect, query, and monitor; Pro and Platform add Optimize, Diagnose, provisioning, and backups.
MongoDB and PostgreSQL are GA; MySQL, Redis, Kafka, and the other discovered engines are Beta. Built for self-hosted deployments, not Atlas or vendor DBaaS. Works offline after install.
PostgreSQL GA MongoDB GA MySQL Redis Kafka Elasticsearch Cassandra ClickHouse CockroachDB Neo4j InfluxDB RabbitMQ + 44 more in Beta
How it works
From zero to full visibility in three steps
Connect → Discover (or provision) → Operate. No agents, no sidecars. Free email to download; offline-first after install.
STEP 01
Connect
Import kubeconfig or Direct Connect
Free
Open DBHelm, go to Environments, and import your kubeconfig — auto-detects cloud provider, region, and cluster. Or use Direct Connect for any database with just a host and port. No agents, no sidecars.
DBHelm scans CRDs, StatefulSets, and Deployments to discover databases across 56 engines — Free forever. Need a new cluster? The Create wizard provisions via 17 built-in providers (Platform license) covering DB-Engines top-10: CNPG / Percona PG / PSMDB / MongoDB Community / MySQL Operator / Redis / K8ssandra / SQL Server / Oracle / Db2 / Strimzi on K8s, plus AWS RDS + Cloud SQL + Azure DB Flexible Server.
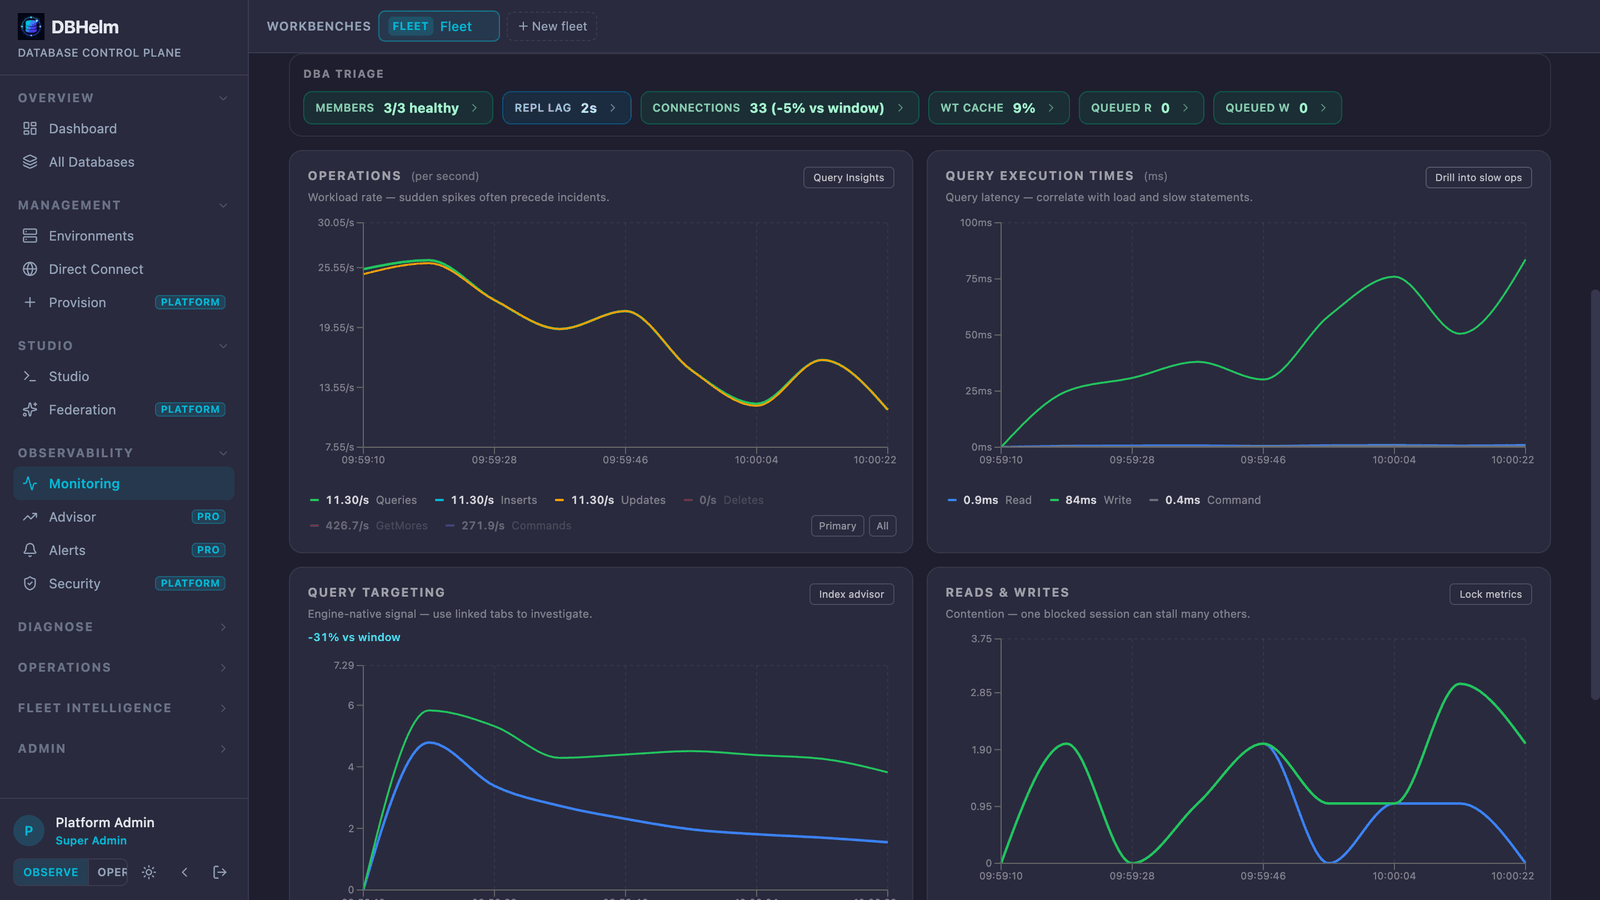
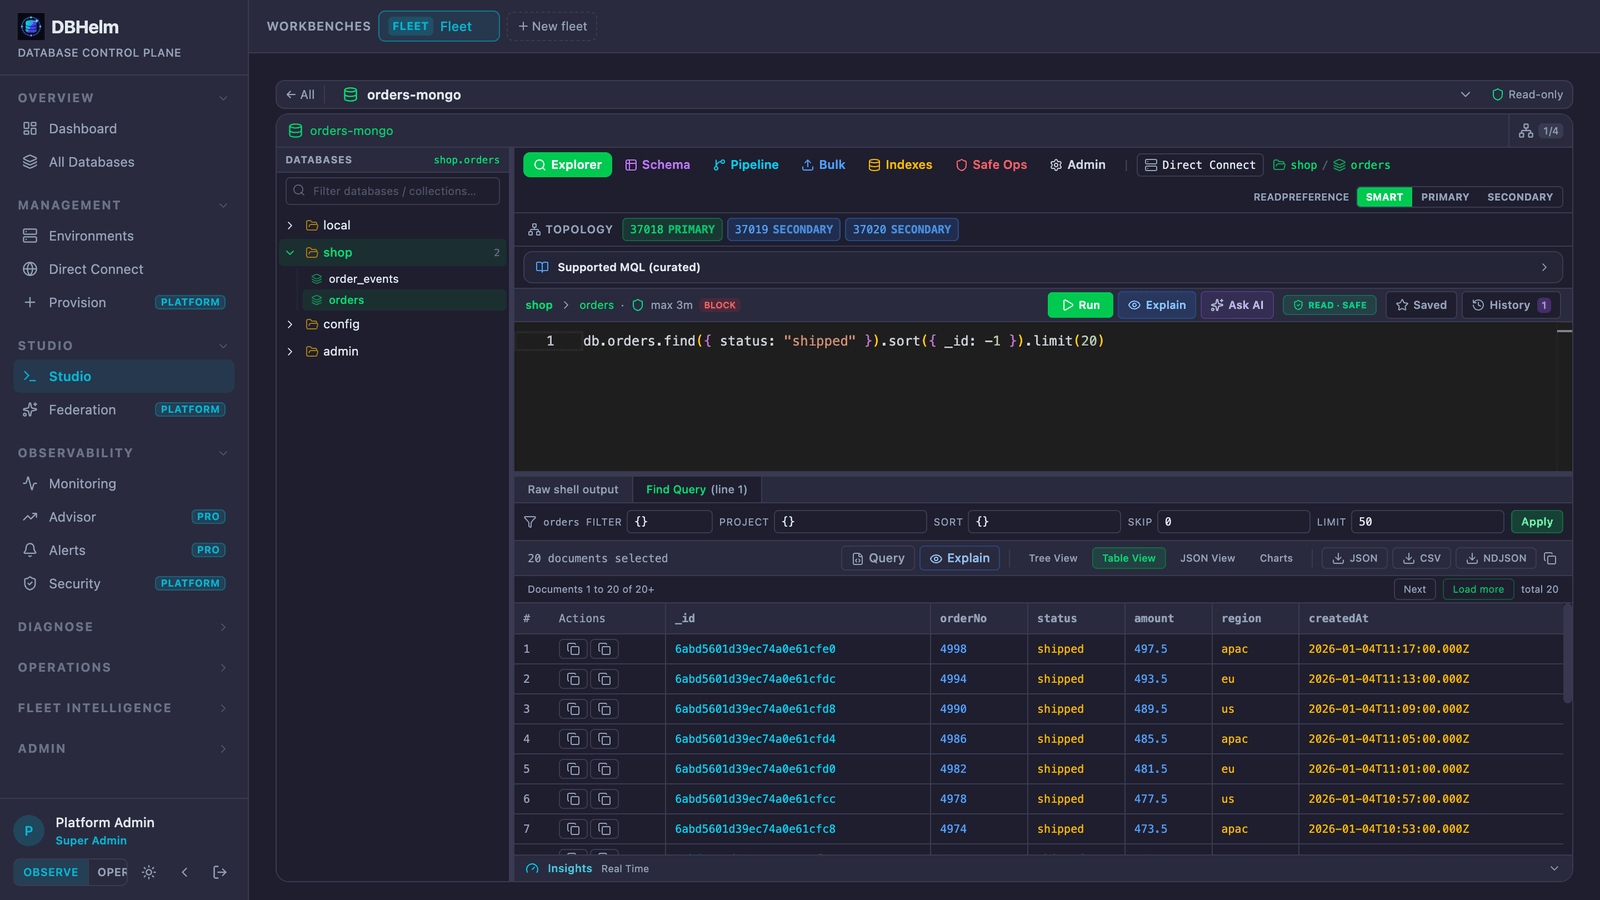
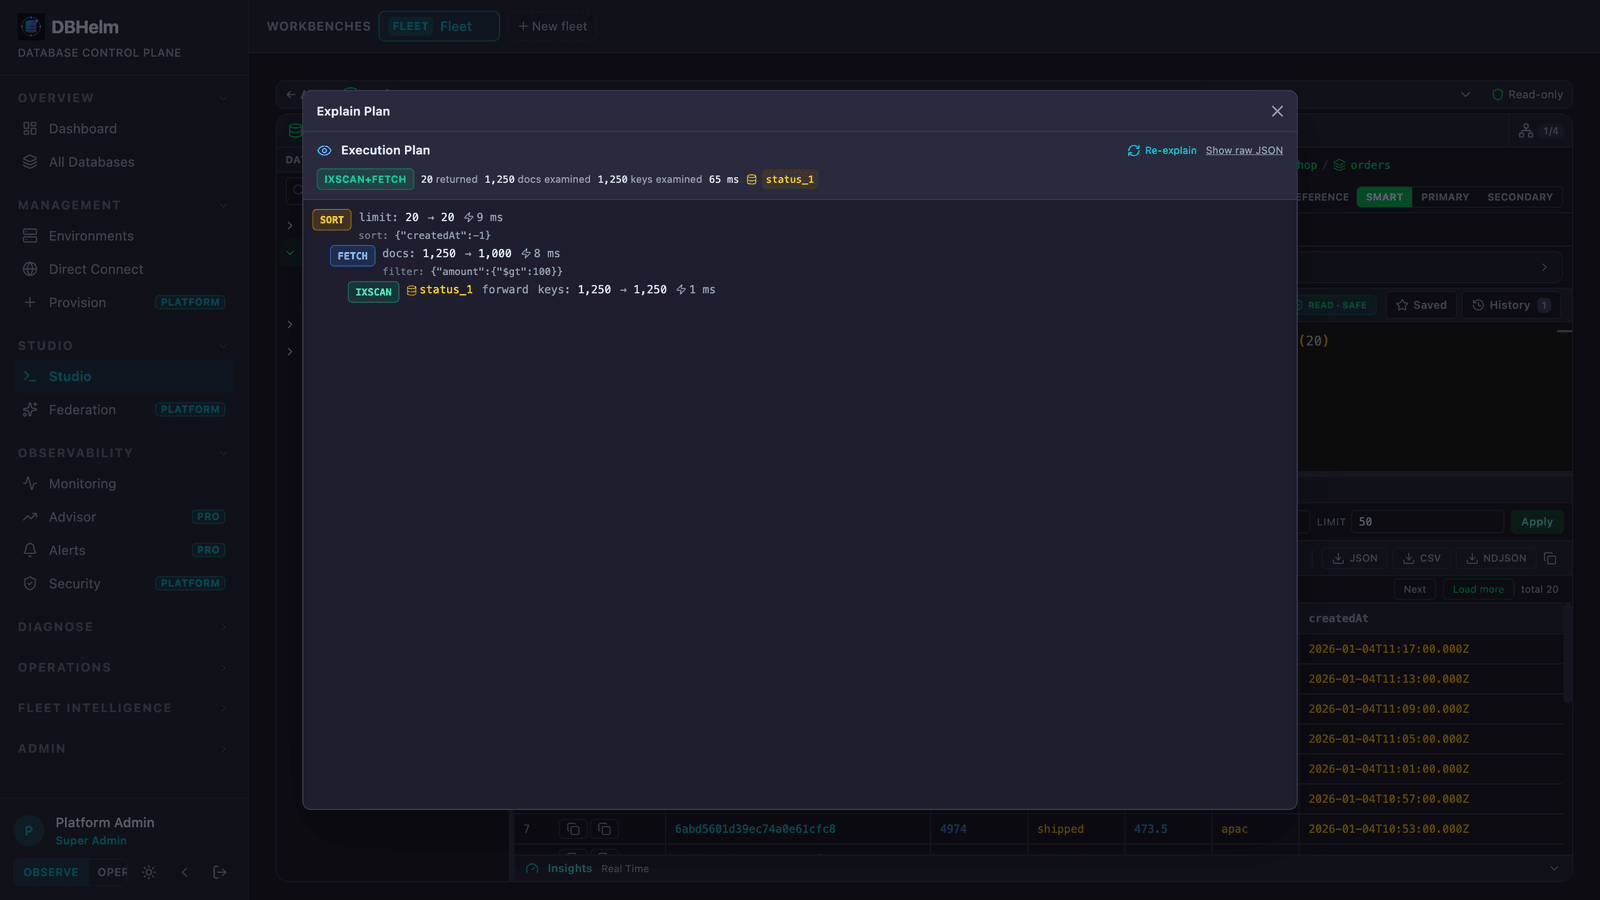
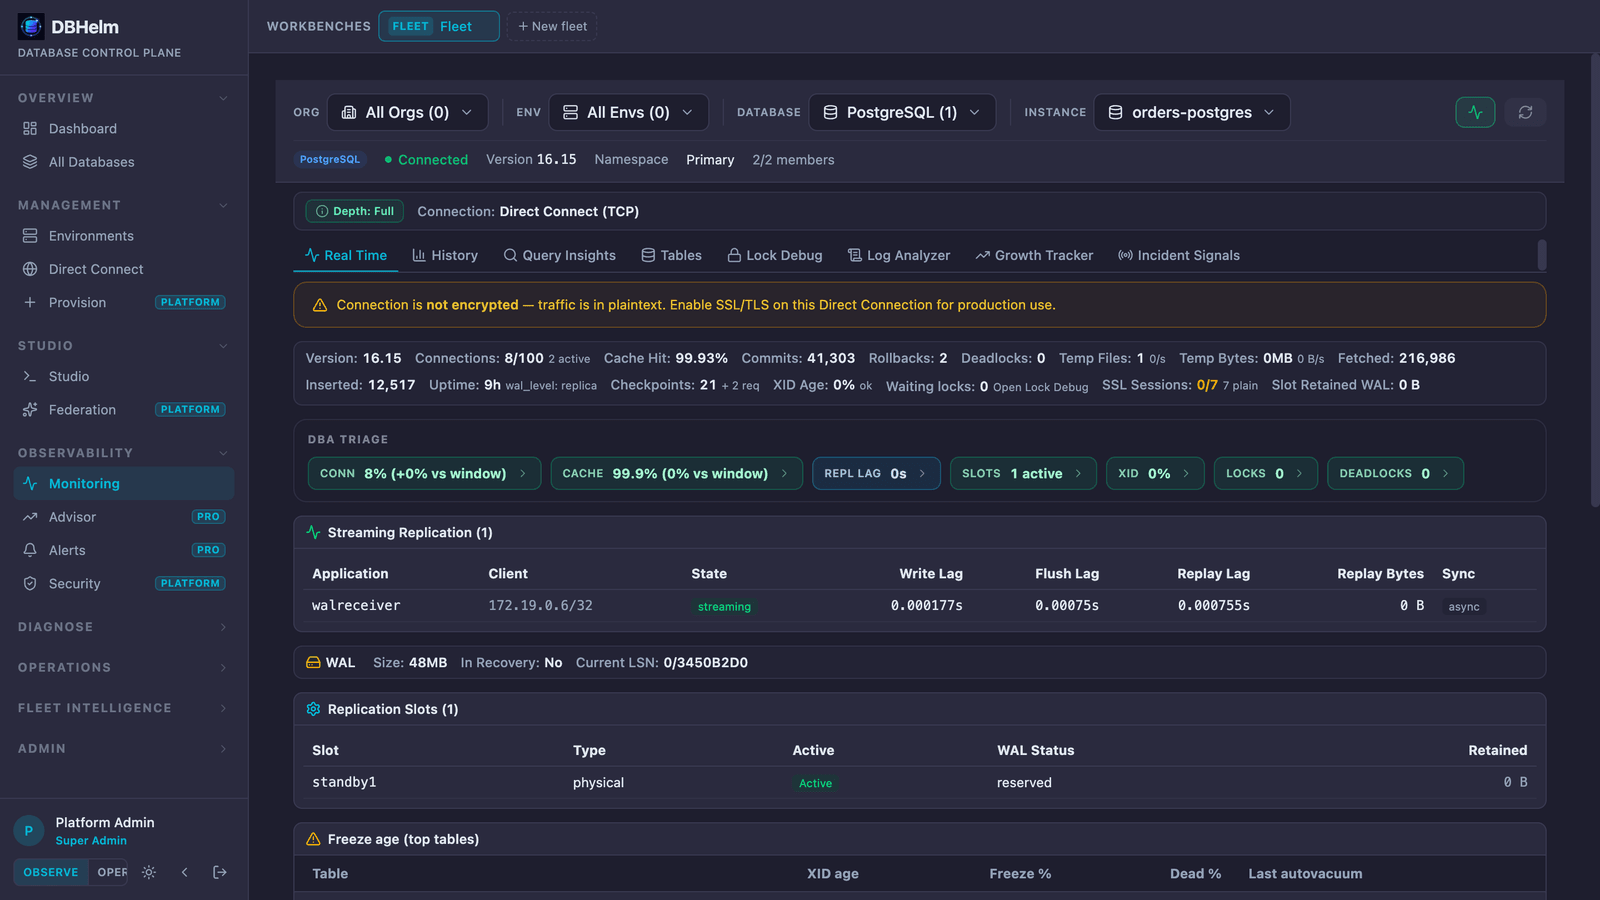
Unedited screenshots of the Free tier against a self-hosted MongoDB replica set and a PostgreSQL primary with a streaming standby — the same desktop app you download.
Prefer a walkthrough? Email
hello@dbhelm.com
for a live demo — or download Free and explore in under two minutes.
Mongo Studio — IntelliShell, topology, and a results grid (Free)
Visual explain — see the index, docs examined, and time per stage
Postgres monitoring — replication lag, WAL, slots, freeze age
Features
Everything you need to operate databases at scale
Replace scattered CLI tools, dashboards, and scripts with a single control plane that understands every database — from PostgreSQL to Kafka to vector databases.
Free
Connect, query, monitor & Studio
Pro
Advisor, Optimize, Diagnose, alerts
Platform
Provision, back up, automate & govern
Universal Discovery
Free
Auto-detect databases across Kubernetes via CRDs, operators, Helm, and StatefulSets. Direct Connect for VMs and bare metal — including self-hosted MongoDB you operate (not Atlas).
Engine-level metrics — oplog lag, WiredTiger cache, replication slots, dead tuples, query latency — not just pod CPU charts. GA for MongoDB and PostgreSQL; InnoDB, Galera, and Kafka consumer lag in Beta.
Chat with an AI DBA scoped to one database or the fleet. Read-only tools, evidence-backed answers, drafts for humans to apply. BYO OpenAI / Anthropic / Ollama.
AI agentRead-onlyFleet modeBYO key
AI Incident RCA & Diagnose
Pro
Window-scoped root-cause analysis from logs, engine internals, slow queries, FTDC (Mongo), and TSDB baselines — plus heuristic no-AI mode.
Root causeAuto-RCA alertsPlaybooksNo-AI mode
Backup & Restore
Platform
Scheduled backups with retention, one-click restore with pre-flight checks, and volume snapshot support with audit trail.
VMs, bare metal, cloud-managed SQL, self-hosted Mongo via TCP / SSH / SOCKS5. No K8s required.
Plugin SDK
Free
Community provisioners and adapters via @dbhelm/sdk, loaded from ~/.dbhelm/plugins/.
56 discovery providers across SQL, NoSQL, Vector, Streaming, Cache, Time-Series, Graph, and more
Every engine below auto-discovers from your Kubernetes clusters; most also work via Direct Connect on VMs you control. MongoDB and PostgreSQL are GA; the rest are Beta.
PostgreSQLSQL · GA
MySQLSQL · Beta
MongoDBNoSQL · GA
RedisCache · Beta
KafkaStream · Beta
ElasticsearchSearch · Beta
CassandraNoSQL · Beta
CockroachDBSQL · Beta
ClickHouseOLAP · Beta
Neo4jGraph · Beta
RabbitMQStream · Beta
InfluxDBTSDB · Beta
MilvusVector · Beta
WeaviateVector · Beta
SQL ServerSQL · Beta
MariaDBSQL · Beta
ScyllaDBNoSQL · Beta
YugabyteDBSQL · Beta
TiDBSQL · Beta
VitessSQL · Beta
etcdKV · Beta
MinIOObject · Beta
DuckDBOLAP · Beta
StarRocksOLAP · Beta
MemcachedCache · Beta
CouchbaseNoSQL · Beta
QdrantVector · Beta
ChromaDBVector · Beta
ValkeyCache · Beta
TimescaleDBTSDB · Beta
+ Oracle, Snowflake, DynamoDB, Cosmos DB, BigQuery, Redshift, Aurora, Db2, SAP HANA, and more
Intelligence
Not just dashboards — advise with Pro, govern with Platform
Pro: Performance / Query / Slow-log / Code Advisors (Mongo + Postgres), Optimize suite, Upgrade Advisor, and Right-Sizing recommendations.
Platform: Playbooks, DR Testing, Compliance, Capacity Forecasting. Transaction Tracer and AI Diagnose are Pro.
Upgrade Advisor
Pro
EOL radar · Pro
Detect EOL versions across your fleet via in-pod version probes (or declared version on Direct Connect), see recommended upgrade paths, and run pre-flight compatibility checks before you touch a pod.
EOL & nearing-EOL detection
In-pod version probe (K8s)
Upgrade path recommendations
Pre-flight breaking-change catalog
EOL radarAlways in the green
Right-Sizing Advisor
Pro
Idle pods → recommendations · Pro · K8s
Find over- and under-provisioned K8s workloads. Compare CPU/memory requests vs metrics-server usage with concrete per-pod recommendations and a fleet efficiency score. Apply resize is Platform (Maintenance).
Fleet efficiency score
CPU & memory waste % per pod
Per-pod actionable recommendations
Pairs with /cost for $ math
Waste %CPU + memory per pod
Incident Playbooks
Platform
Runbook automation · Platform · K8s
Five pre-built diagnostic playbooks for 3am incidents: high CPU, replication lag, pool exhaustion, disk, slow queries. Auto-runs checks via kubectl exec; findings ranked by severity.
5 pre-built templates
Auto-run diagnostic steps
Severity-ranked findings
Session execution history
5 templatesK8s-discovered DBs
DR Testing
Platform
Failover simulation · Platform · K8s
Score every K8s-discovered database on DR readiness. Evaluate backup freshness, replica health, and failover readiness — then dry-run failover without touching production.
DR readiness score (0-100)
RPO from last snapshot age
RTO heuristic from replicas + size
Dry-run failover simulation
RPO/RTOEstimated per database
Compliance Engine
Platform
Policy-as-code · Platform
Build policies from seven built-in checks — backup, alerting, replicas, SSL, connections, resource limits, password policy. Per-DB pass/fail with severity. Session-scoped today; persistence on the roadmap.
7 built-in check types
Severity levels (critical → low)
Per-DB pass/fail reports
Session-scoped policies
7 checksBuilt-in policy catalog
Capacity Forecasting
Platform
Days-until-full · Platform · K8s metrics
Linear-regression projections for storage, memory, and connections. Days-until-full, growth rate, and urgency tiers from metrics-server + engine queries.
Storage, memory & connections
Days-until-full (linear regression)
Growth rate / day
Urgency tiers
ForecastStorage · Mem · Conn
Transaction Tracer
Pro
Live queries · Pro · K8s
Real-time active / slow queries and connections for PostgreSQL, MySQL, MongoDB, and Redis. Lock graphs for PG + MySQL. Part of AI Diagnose / Platform.
Stop paying SaaS markup on databases you could run yourself.
MongoDB Atlas, AWS RDS, Confluent Cloud, ClickHouse Cloud and the rest charge
2–4× the raw infrastructure cost for the same hardware.
DBHelm gives you the monitoring, backups, DR, and day-2 operations of a managed service
on your own cloud — so you pocket the difference.
MongoDB replica set
3 nodes · 16 GB RAM · 100 GB data
MongoDB Atlas M40$751/mo
$1.04/hr on AWS + backup + egress
DBHelm + EKS (Percona or Bitnami)$300/mo
3× r6i.large · 300 GB gp3
Monthly savings60% off
$451/ mo
$5,412 per year
Postgres HA cluster
Primary + 2 replicas · 32 GB RAM · 500 GB data
AWS RDS Multi-AZ db.r6g.xlarge$1,275/mo
Multi-AZ premium + gp3 + backup
DBHelm + CloudNativePG on K8s$650/mo
3× r6i.xlarge · 1.5 TB gp3
Monthly savings49% off
$625/ mo
$7,500 per year
Kafka streaming cluster
3 brokers · 8 vCPU / 32 GB · 500 GB logs
Confluent Cloud Standard$2,800/mo
Base + ingress + egress + storage
DBHelm + Strimzi on K8s$900/mo
3× m6i.2xlarge · 1.5 TB gp3
Monthly savings68% off
$1,900/ mo
$22,800 per year
A small fleet of 10 databases typically saves
$60,000–$150,000 a year.
The managed-DB markup is the premium you pay to skip ops work.
DBHelm removes most of that work — auto-discovery, monitoring,
backups, DR testing, incident playbooks, right-sizing, capacity
forecasting — so the markup stops making sense.
Whether you're building a platform, responding to incidents, or optimizing performance — DBHelm adapts to your workflow.
Platform EngineersPlatform-led
Build a self-service database platform
"We need one tool to provision + manage Postgres on RDS, Mongo on K8s, and Kafka via Strimzi — without writing terraform glue and bespoke runbooks."
Give your teams a unified provisioning + management plane. The wizard creates clusters via 17 built-in providers covering every DB-Engines top-10 engine; the declarative state YAML codifies your fleet so a CI pipeline can apply it.
Provision via CNPG / Percona PG / PSMDB / MongoDB Community / MySQL Operator / Redis / K8ssandra / SQL Server / Oracle / Db2 / Strimzi on K8s, or RDS / Cloud SQL / Azure DB managed
Declarative state YAML: dbhelm plan / apply / export from CI
GitOps event log + replay: every state change is reproducible
10-entry Operator Hub: one-click prereq install with cluster-scope ack guard
Plugin SDK to extend with internal-only providers; multi-org RBAC; audit log
SREs + DevOpsFree + Pro
Reduce MTTR with deep observability + safe queries
"At 3am when a database is slow, I need engine-level metrics — InnoDB lock waits, replication lag, slow queries — not pod CPU. And I need to query the live DB without fear of running DROP by mistake."
Engine-aware dashboards, the live transaction tracer, the AI assistant that classifies destructive ops before you can run them, and a console that defaults to read-only. Plus the drift detector tells you when live state doesn't match desired.
Drift detector + GitOps log so you know what changed
DBAsPro + Platform
One tool for backups, migrations, federation + cost
"I manage Percona on K8s, RDS Postgres, a bare-metal MySQL we want to migrate to Postgres, and we're trying to figure out which managed DB is bleeding money."
On-demand + scheduled backups with one-click restore. MySQL→Postgres migration in three clicks. Eight Optimize tools (Query/Code Optimizer, Index Janitor, Schema Doctor, Autovacuum Pressure Map, Pool Fit, Plan Watch, Cost) cover everything from query rewriting to wraparound emergencies. Cross-engine federation lets you JOIN across Postgres + MySQL DBs without ETL.
Backups: CNPG / PSMDB / Percona PG / MySQL Operator / RDS / Strimzi MM2; PITR for PSMDB
Optimize section (8 tools): Query/Code Optimizer · Index Janitor · Schema Doctor · Autovacuum · Pool Fit · Plan Watch · Cost
Plan Watch (v1.27): re-EXPLAIN every 30 min, alert on plan-shape change or ≥2× cost jump — catch post-deploy regressions before customers do
MySQL → Postgres migration: schema infer, type mapping, batched pump, validation
Cross-engine federation via embedded DuckDB (Postgres + MySQL families)
Index, schema, and query advice with DDL you review and apply — Pro
Yes
Partial
No
No
No
Root-cause analysis from logs + engine signals, on your own AI key — Pro
Yes
Partial
No
No
No
Provisioning, backups, and PITR on K8s operators and cloud — Platform
Yes
Yes
Partial
No
No
Trade-offs
Works offline; credentials never leave your machine
Yes
No
Yes
Partial
Yes
Runs the database for you (automatic failover, patching, scaling)
No
Yes
No
No
No
Browser access for the whole team, nothing to install
No
Yes
No
Yes
No
Full support Beta Partial Not supported
Managed DBaaS (Atlas, RDS, Cloud SQL) wins on hands-off backups, failover, and zero-ops scaling — for its own vendor instances. DBHelm is the control plane for databases you operate (K8s, VMs, bare metal, cloud-managed SQL via Direct Connect). Self-hosted Mongo is in scope; Atlas is not a first-class target. Use both: let managed services run what they run, and use DBHelm for the rest of your fleet.
The full feature list lives in the Docs.
DBHelm is a desktop app. Your credentials and metadata stay on your machine. Read-only is the default; destructive operations require explicit confirmation.
AES-256-GCM Encryption
All credentials and kubeconfigs encrypted at rest in the local SQLite store
Destructive-op Classifier
DROP / DELETE / TRUNCATE / dropDatabase / TopicDelete blocked until you confirm
Every release runs the full test suite on Linux + macOS + Windows before binaries are published. Coverage spans destructive-op classification, type mapping, rate-card lookups, federation, EXPLAIN safety, credential redaction, and more.
Every release ships with a per-feature changelog: what shipped, what's in beta, what we cut. No vapor — what's on the changelog is what's in the binary you download.
Free to connect & monitor. Pro to advise. Platform to operate.
Free forever for connect, query, monitor, and Studio. Pro adds Advisor, Optimize, Diagnose, and alerts. Platform adds provisioning, backups, GitOps, and governance. Contact hello@dbhelm.com for Pro or Platform.
DBHelm
₹0/ forever
Free
Unlimited Direct Connections + registered Kubernetes environments
Real-time monitoring with embedded Topology + live query insights
Console / Studio with deep adapters + safe-by-default queries
Self-hosted Mongo Studio (PSMDB / Community / K8s / Direct Connect)
Fleet cost rollup; local users & roles; offline-first
DBHelm is a source-available desktop control plane for databases you operate. Free: discover, connect, query, monitor, and Studio across 56 engines on Kubernetes and Direct Connect. Pro: Advisor, Optimize suite, AI Diagnose, alerts, and BYO-AI. Platform: provision (17 providers), Operator Hub, backups & PITR, federation, migration, GitOps, and governance. Self-hosted Mongo Studio is included on Free — not a replacement for MongoDB Atlas or vendor DBaaS.
MongoDB and PostgreSQL are GA. Every push runs an automated suite of end-to-end journeys in the real desktop app against seeded MongoDB and PostgreSQL databases (connect, Studio, queries, explain plans, the destructive-SQL gate, live monitoring), each within a time budget. Every other engine is Beta: discovery, Console, and monitoring ship and are unit-tested, but they are not covered by that end-to-end contract, and a Beta regression does not block a release. Report Beta issues to hello@dbhelm.com.
Which clusters can DBHelm provision (not just discover)?
17 today across two categories. Eleven K8s operators / patterns: CloudNativePG (Postgres) · Percona PG · Percona Server for MongoDB (PSMDB) · MongoDB Community Operator (MongoDB Inc.) · MySQL Operator (Oracle InnoDB Cluster) · Redis Operator (Spotahome) · K8ssandra (Apache Cassandra) · SQL Server StatefulSet · Oracle Database Operator (OraOperator) · IBM Db2u Operator · Strimzi (Kafka). Six cloud-managed services: AWS RDS Postgres + MySQL · Cloud SQL Postgres + MySQL · Azure Database for PostgreSQL + MySQL Flexible Server. Plus a 10-entry Operator Hub for one-click prereq install of the K8s operators above (CNPG / PSMDB / MongoDB Community / MySQL Operator / Redis / K8ssandra / Strimzi / Percona PG / Oracle / Db2u). Scheduled backups, restore flows, and object admin all work from the same UI.
What does the Query Optimizer do? (v1.23)
Pick a connected database, paste a query, click Optimize. The backend introspects live schema (sizes / indexes / column cardinality from information_schema / pg_class / collStats), runs a safe read-only EXPLAIN (never ANALYZE), and asks your configured AI provider to rewrite it with engine-specific best-practice hints (Postgres LATERAL, Mongo ESR rule, Cassandra ALLOW FILTERING red flag, etc.). Returns the rewrite + index suggestions with exact CREATE INDEX DDL + tradeoff notes. Your original query is never executed — only EXPLAIN runs.
What does the Code Optimizer do? (v1.23)
Paste application code in any of 12 languages (TS / JS / Python / Java / Go / Ruby / C# / PHP / Rust / Kotlin / Scala / SQL), optionally link a connected DB for engine-aware suggestions. Returns categorized issues (performance / safety / security / maintainability with severities low → critical) and a rewritten version. Looks for N+1 query patterns, missing pagination, string-concatenated SQL, sync DB calls in async paths, missing batch operations, ORM over-fetching. Credentials in your code are redacted before reaching the AI provider — we surface the redaction count.
What's free, and what needs a license?
Free, forever: connect, query, monitor, and Studio on existing databases — Direct Connections and registered Kubernetes environments, self-hosted Mongo Studio — with no usage caps. Download requires a free DBHelm account (email + one-time code); the desktop app then runs offline-first. Pro (offline license key in Settings) unlocks Advisor + the Optimize suite, AI Diagnose (Incident RCA, Virtual DBA, Transaction Tracer, on-demand Health Check), alerts (email / Slack / webhook), and the BYO-AI assistant. Platform adds provisioning + Operator Hub, backups & PITR, maintenance, GitOps / schedulers, federation, migration, and governance (audit export, compliance, DR, playbooks). Separately, the BSL 1.1 license means you can't re-sell DBHelm itself as a managed service; internal use is unlimited. BSL auto-converts to Apache 2.0 four years after each release.
Website account vs desktop Register — what is the difference?
Two separate logins. (1) Website /account uses email + a 6-digit one-time code (no password) so you can download installers, view licenses, buy Pro/Platform via Lemon Squeezy, and open the Lemon billing portal when you have a paid plan. (2) The desktop app has its own local Register / Login (email + password) that creates the super-admin and local users in encrypted SQLite on your machine. A website account does not log you into the desktop app, and vice versa — unless you paste or refresh a Pro/Platform license key in Settings → License.
Can I run DBHelm fully air-gapped?
Yes after you have the installer. Download once from /account (needs email OTP), then install on an air-gapped machine. Credentials stay local; no phone-home of query results. Skip website sign-in in the app, disable optional error reporting, and activate Pro/Platform with an offline license key if needed. Update checks and Lemon checkout need network — transfer installers/keys via your approved channel when fully isolated.
What are the prerequisites?
For Kubernetes databases: kubectl and a kubeconfig file. For Direct Connect: just the host, port, and credentials. No agents, sidecars, or cloud accounts needed.
Which Kubernetes distributions work?
Any standard K8s cluster — EKS, GKE, AKS, OpenShift, Rancher, k3s, minikube, and bare-metal. If kubectl can reach it, DBHelm can manage it.
How does auto-discovery work?
DBHelm scans Kubernetes namespaces for Custom Resource Definitions (CRDs), StatefulSets, Deployments, and Helm releases that match known database patterns. It detects the database type, operator, version, and cluster topology automatically.
What is the Console and how is it safer than running queries directly?
Console is a single entry point that detects the database type and loads a native IDE: MongoDB collection browser, SQL schema tree, Redis keyspace scanner, Kafka topic + consumer-group explorer, Elasticsearch index browser, vector collection viewer with similarity-search starters, Neo4j graph schema, InfluxDB bucket tree, and SaaS adapters for BigQuery / Snowflake / Redshift / Databricks with pre-flight $-cost estimates. Engines we don't deep-adapter yet fall through to a generic Command adapter. Every adapter is read-only by default: DROP / DELETE / TRUNCATE / dropDatabase / KafkaTopic-delete are detected and blocked until you explicitly confirm. Every mutation is audit-logged and mirrored into the GitOps event log.
How does the AI assistant work? Is my schema sent anywhere?
Bring your own key for OpenAI, Anthropic, or any OpenAI-compatible endpoint (Ollama for local). DBHelm never proxies through us — your prompts go straight to the provider you configure. Every LLM-generated query passes through the same destructive-op classifier as a hand-typed query, plus (for SaaS engines) a dry-run cost estimate, before you can execute. The LLM never auto-executes anything.
What does cross-engine federation mean? How does it work?
DBHelm embeds DuckDB. Pick which Postgres + MySQL Direct Connections to attach, give each an alias, and write ANSI SQL like SELECT * FROM pg_app.users JOIN my_orders.orders ON ... — joins push down to native scanners when they can. Today: Postgres family (CNPG / RDS / Cloud SQL / Azure DB / Cockroach / Citus / Timescale / Yugabyte) and MySQL family (RDS / Cloud SQL / Azure DB / MariaDB / PXC / Vitess). Mongo / Snowflake / BigQuery support is on the roadmap via materialization.
What does declarative state and the GitOps log give me?
Write a single state.yaml describing your clusters, objects (databases / roles / schemas / topics), and backup schedules. dbhelm plan shows the diff vs live; dbhelm apply executes via the same registries the UI uses; dbhelm export captures current state. Every state-changing event also writes to ~/.dbhelm/state/state-history.jsonl, optionally pushed to a Git remote via DBHELM_STATE_GIT_REPO. Click "Replay to here" on any historical event in the GitOps log page and the YAML for that point-in-time lands in your clipboard.
How does the cost dashboard estimate spend without my cloud bill?
Built-in rate cards for AWS RDS (14 instance classes), Cloud SQL (6 tiers + custom-shape formula), Azure Flexible Server (8 SKUs), and K8s defaults. We multiply by replicas + storage to get a monthly + annual estimate per cluster. As of v1.25 the dashboard counts EVERY database in your fleet — provisioned + K8s-discovered + Direct Connect — not just clusters DBHelm provisioned. v1.26 added per-table cost attribution (70% storage + 30% compute weighted) so a 1MB hot table that gets scanned 100K times/day still gets a real slice, plus a storage tier ladder (gp2 → gp3, io1 → gp3 when IOPS demand is low, pd-ssd → pd-balanced for OLTP). SaaS engines (BigQuery / Snowflake) bill per-query, so they show $0 with a pointer to the per-query cost preview in the Console. Live billing-puller integration (AWS Cost Explorer / GCP Billing / Azure Cost Management) is on the roadmap.
What's in the Optimize section?
Eight focused tools as of v1.27 — each does one thing well: (1) Query Optimizer — paste a query, get an AI rewrite using live schema + safe EXPLAIN. (2) Code Optimizer — paste app code in 12 languages, get categorized issues + a rewrite. (3) Index Janitor — finds unused / duplicate / low-usage / missing-FK indexes with the exact DROP INDEX CONCURRENTLY DDL. (4) Schema Doctor — tables-without-PK, missing-FK indexes, ≥80% NULL columns, oversized text, never-ANALYZEd. (5) Autovacuum Pressure Map — Postgres-specific bloat / stale stats / wraparound emergency check. (6) Pool Fit — samples pg_stat_activity 3× and returns a Fit Score 0-100 + recommended pool size. (7) Plan Watch — register a query, DBHelm re-EXPLAINs every 30 min, alerts when plan changes or cost ≥2× jumps. (8) Cost — full-fleet aware, per-table attribution, storage tier ladder. All read-only — they generate DDL but never execute it. The DDL gets copied into Console (which has the destructive-op confirm gate).
What is Plan Watch and when should I use it?
Plan Watch is for catching the post-deploy "everything's slow now" class of bugs BEFORE customers do. You register a query (typically your hottest few — top customer dashboard, daily report, login lookup); DBHelm re-EXPLAINs it every 30 minutes (and on demand) and fingerprints the plan tree shape. When Postgres switches access path (Index Scan → Seq Scan, or one index → another), OR cost jumps ≥2× with the same plan shape, the run gets flagged as a regression with a one-line diff explanation ("Plan shape changed: Index Scan using foo_pkey → Seq Scan", "Cost jumped 5× — usually means table grew faster than stats updated"). Pure EXPLAIN — never executes the actual query.
What does the migration engine do today?
MySQL → Postgres in three clicks: pick a source MySQL Direct Connection, pick a target Postgres Direct Connection, plan, execute. Schema is inferred via information_schema; type mapping handles tinyint(1)→bool, AUTO_INCREMENT→SERIAL, JSON→JSONB, ENUM→TEXT (lossy, flagged), unsigned ints widening, etc. Data streams in pages of 1,000 (configurable) with per-table row-count validation. Mongo → Postgres and DynamoDB → Postgres are on the roadmap.
What about playbooks and DR testing — do they work for any database?
Honest scope: Incident Playbooks, DR Testing, Right-Sizing, Transaction Tracer, and the embedded Topology view in Monitoring all require Kubernetes (we talk to the operator + pods directly). Capacity Forecasting needs the K8s metrics-server for live metrics. Upgrade Advisor and Compliance work on both K8s and Direct Connect (Upgrade Advisor falls back to declared version when in-pod probes are unavailable).
Can I connect to non-Kubernetes databases?
Yes. Direct Connect registers databases you operate on VMs, bare metal, or cloud-managed SQL (AWS RDS, Google Cloud SQL, Azure Database) by host, port, and credentials. For MongoDB, DBHelm targets self-hosted deployments (mongod / replica sets / sharded clusters, SSH-tunneled or SOCKS5) — not MongoDB Atlas or other vendor DBaaS as a first-class target. SaaS engines (BigQuery / Snowflake / Redshift / Databricks) also use Direct Connect with their respective auth methods.
Does it send my data to the cloud?
No. The desktop app is offline-first after install: credentials and kubeconfigs stay in a local encrypted SQLite store (AES-256-GCM). Optional opt-in error reporting can be enabled in Settings. Outbound calls are only: (1) cloud APIs you configure (Kubernetes / RDS / Cloud SQL / etc), (2) your BYO AI provider when you enable Pro AI features, (3) optional Git remote when DBHELM_STATE_GIT_REPO is set, (4) a lightweight update check (Windows/Linux can install in-app; macOS opens the download flow at dbhelm.com/account until Developer ID signing ships), and (5) the DBHelm accounts API if you sign in for download logging, license activation, or subscription management. Website signup uses email one-time codes; paid checkout is via Lemon Squeezy.
Can I extend it without forking?
Yes — the @dbhelm/sdk package exposes typed interfaces for ClusterProvisioner, BackupProvider, ScheduleProvider, ObjectAdminProvider, and SaasProvider. Drop a .mjs file into ~/.dbhelm/plugins/ and DBHelm loads it at boot. The /plugins page (super-admin only) shows what loaded, manifest details, and reason-if-skipped.
Why does SmartScreen / Gatekeeper show a warning?
macOS builds are currently unsigned (Developer ID + notarization is on the roadmap — see the download page). On macOS run: xattr -dr com.apple.quarantine /Applications/DBHelm.app, or right-click → Open. On Windows click "More info" → "Run anyway". Windows/Linux in-app updates still work without Mac signing.
Which Linux download should I use?
On Ubuntu or Debian, install the .deb (sudo apt install ./DBHelm-<version>-linux.deb): it sets up Chromium's sandbox, adds DBHelm to the app menu, and updates in-app. The AppImage runs on any x64 distro but needs FUSE 2 (sudo apt install libfuse2t64 on Ubuntu 24.04, libfuse2 on 22.04). On Ubuntu 24.04 and later an AppImage cannot install the AppArmor profile Chromium's sandbox needs, so it starts without the sandbox there; the .deb always keeps it. Every release installs and launches both packages on Ubuntu before it is published.